In this post, I will show how to use machine learning with GoLang to build a model to predict what makes a video follow-worthy on my TikTok based on my posts so far.
The data set was created by going through my videos and manually inputting data into a google sheet. For whatever reason, TikTok doesn't have an easily accessible API, and paid products are expensive.
TL;DR
Dataset
Unfortunately, TikTok doesn't make collecting video analytics data on posts simple. There is an API, but it seems to be built around users of it creating products for TikTok Users, not for analytics.
And there's not a working version of an Unofficial API either--seems TikTok has enabled captchas to prevent data scraping.
Yet, there is a paid option for scraping data, but that's not for poor content creators like me.
So instead, I scoure the data by hand because there's no way to download analytics beyond 7 days (thanks TikTok).
Here's the data manually scraped from my profile.
Feel free to add your data if you'd like via a Pull Request. Just make sure that you capture the same features (columns). If everyone pitches in, then maybe we'll be able to get a general idea of how the algorithm works.
Now, let's get to it.
I. Data Exploration
The first to do is to get familiar with the data set. We'll look at the basics by opening the data within Google Sheets.
First, the dimensions, AKA the rows, and columns.
I.a Dimensions of the data set
Rows = 194
Columns = 14
The rows, in this case only number 194, which in data science 1000 is considered small, so this one is micro in comparison.
As for the columns, we are in better shape as there are 14, which is not even close to being half the size of the number of rows, which would be a real headache for model building.
I.b Types
Data types = text, integer, and decimal
There's nothing too surprising here or problematic. Since I made the dataset, I made sure to keep it simple. Still, there is room for data engineering with the 'category' and 'subject' columns.
Ideally, we'll want to expand the columns of the data set such that we can say whether or not a video has that category or subject by using '0' and '1' respectfully.
This is because at the heart of machine learning are mathematical formulas that require numbers of some sort to work.
Hence, we're transforming text data into numerical data in the next section.
II. Data Pre-processing aka Cleaning
As we found in data exploration, there are different types of data; decimal, text, and whole number integer.
However, there is also the issue of missing data. As the data set builder, I know that the '0's are problematic for the columns of watchedFullVideo and newFollowers. While manually trudging through my videos' statistics, it was observed that watchedFullVideo and newFollowers were missing values. So, I put 0 in as a placeholder. We'll address the value problem in the Imputation Section.
GoLang doesn't have any up-to-date preprocessing libraries. So our tool of choice for preprocessing data will be Excel or Google Sheets.
So, open up the raw data I provided in your preferred spreadsheet editor and follow along as we tidy up the data set.
II.a Feature reduction
First, we'll remove rows of data with just a few occurrences. So, looking at the categories of Category and Subject, we'll sort [A-Z], and rows with 5 or fewer occurrences for that category or subject will be deleted. I'm doing this as a judgment call. Typically, machine learning algorithms do better when the sample types are of similar numbers. And the reader may observe that other categories number in the 5 plus number for record amounts.
II.b Encoding
We'll programmatically rebuild the dataset to be expanded to include columns named 'info-data analytics' and so on from the 'category' and 'subject' columns.
Here's the code for that
// convertCategorical is a basic function encodes a categorical variable as a slice of floats.
func convertCategorical(a string, index map[string][]int, varName string) ([]float64, []string) {
   retVal := make([]float64, len(index)-1)

   // important: Go actually randomizes access to maps, so we actually need to sort the keys
   // optimization point: this function can be made stateful.
   tmp := make([]string, 0, len(index))
   for k := range index {
      tmp = append(tmp, k)
   }

   // numerical "categories" should be sorted numerically
   tmp = tryNumCat(a, index, tmp)

   // find NAs and swap with 0
   var naIndex int
   for i, v := range tmp {
      if v == "NA" {
         naIndex = i
         break
      }
   }
   tmp[0], tmp[naIndex] = tmp[naIndex], tmp[0]

   // build the encoding
   for i, v := range tmp[1:] {
      if v == a {
         retVal[i] = 1
         break
      }
   }
   for i, v := range tmp {
      tmp[i] = fmt.Sprintf("%v_%v", varName, v)
   }

   return retVal, tmp[1:]
}
This is done in memory as the program executes. Still, I wanted to highlight which function is responsible for doing so.
III. Imputation
TikTok data collection is annoying because sometimes videos do not provide the data. They're inconsistent. Some videos show followers gained from viewing, and some videos don't (most).
Further, some videos show the completion rate for viewing, and some don't. There's no pattern to why the TikTok platform decides to provide data for one video versus another.
Although frustrating, this occurrence in the data analytics world isn't uncommon. When faced with missing values, there are two options: delete the rows or substitute missing values.
To know when to delete the values, use the formula:
( # rows with missing data/number of rows ) * 100 = result
If the result is greater than 2%, then do not delete the data.
Our data set is too small, so we will use substitution in the form of Imputation.
III.a Imputation for newFollowers column
For the newFollowers column, we'll replace the zero with the most frequent number of followers gained. The most frequent number is 1, but it could be argued that it is 0.
I know from watching my video analytics that some videos have led to tens of followers, so it's a shame that data doesn't exist. So, where there are zeros, we'll put the number 1.
Sort the column from Z-A, put a '1' in the first 0 spots, and drag it down.
III.b Imputation for watchedFullVideo column
In this one, we'll put the avg value calculated from the values in the column. First, sort the data Z-A, select all values > cmd > explore > AVG, and the number will show. Put the number into the first zero spots and drag it down.
Final processed data
IV GoLang Machine Learning using Linear regression
- Source Code
- Citation: Most of the code is barely altered from the Go Machine Learning Projects by Xuanyi Chew
We'll use Linear Regression to see if we can craft a model to predict what variable(s) lead to more followers. A part of building a useful model is experimenting with different model types such as Random forests, Boruta, and many others.
But to keep it simple, we'll use the first one that most encounter when starting in machine learning.
IV. Algorithm Walkthrough
I've included the code found within the main.go main function with comments explaining what is being done below.
To see all of the code, please refer to the repo
// Open file
f, err := os.Open("tik-tok-new-followers-imputated.csv")
mHandleErr(err)

// Build data frame (excel sheet in memory)
hdr, data, indices, err := ingest(f)

// Clean data and do Categorization of the 'subject' and category columns
rows, cols, XsBack, YsBack, newHdr, newHints := clean(hdr, data, indices, datahints, ignored)
// Get the variable(s) together for predicting (Y) the newFollowers column
Xs := tensor.New(tensor.WithShape(rows, cols), tensor.WithBacking(XsBack))
it, err := native.MatrixF64(Xs)
if err != nil {
   log.Fatalf("err native: ", err)
}
mHandleErr(err)

// Scale the predicted variable
for i := range YsBack {
   YsBack[i] = math.Log1p(YsBack[i])
}

// Scale the predictor variables
transform(it, newHdr, newHints)

// partition the data
shuffle(it, YsBack)
// Testing & Training data
testingRows := int(float64(rows) * 0.2)
trainingRows := rows - testingRows
testingSet := it[trainingRows:]
testingYs := YsBack[trainingRows:]
it = it[:trainingRows]

// Variable trying to predict aka newFollowers column
YsBack = YsBack[:trainingRows]

// Execute the linear regression model
r, stdErr := runRegression(it, YsBack, newHdr)
tdist := distuv.StudentsT{Mu: 0, Sigma: 1, Nu: float64(len(it) - len(newHdr) - 1), Src: rand.New(rand.NewSource(uint64(time.Now().UnixNano())))}
fmt.Printf("R^2: %1.3f\n", r.R2)
fmt.Printf("\tVariable \tCoefficient \tStdErr \tt-stat\tp-value\n")
fmt.Printf("\tIntercept: \t%1.5f \t%1.5f \t%1.5f \t%1.5f\n", r.Coeff(0), stdErr[0], r.Coeff(0)/stdErr[0], tdist.Prob(math.Abs(r.Coeff(0)/stdErr[0])))
for i, h := range newHdr {
   b := r.Coeff(i + 1)
   e := stdErr[i+1]
   t := b / e
   p := tdist.Prob(math.Abs(t))
   fmt.Printf("\t%v: \t%1.5f \t%1.5f \t%1.5f \t%1.5f\n", h, b, e, t, p)
}

// simple cross validation
var MSE float64
for i, row := range testingSet {
   pred, err := r.Predict(row)
   mHandleErr(err)
   correct := testingYs[i]
   eStar := correct - pred
   e2 := eStar * eStar
   MSE += e2
}
MSE /= float64(len(testingSet))
fmt.Printf("RMSE: %v\n", math.Sqrt(MSE))
V. Linear Regression Results
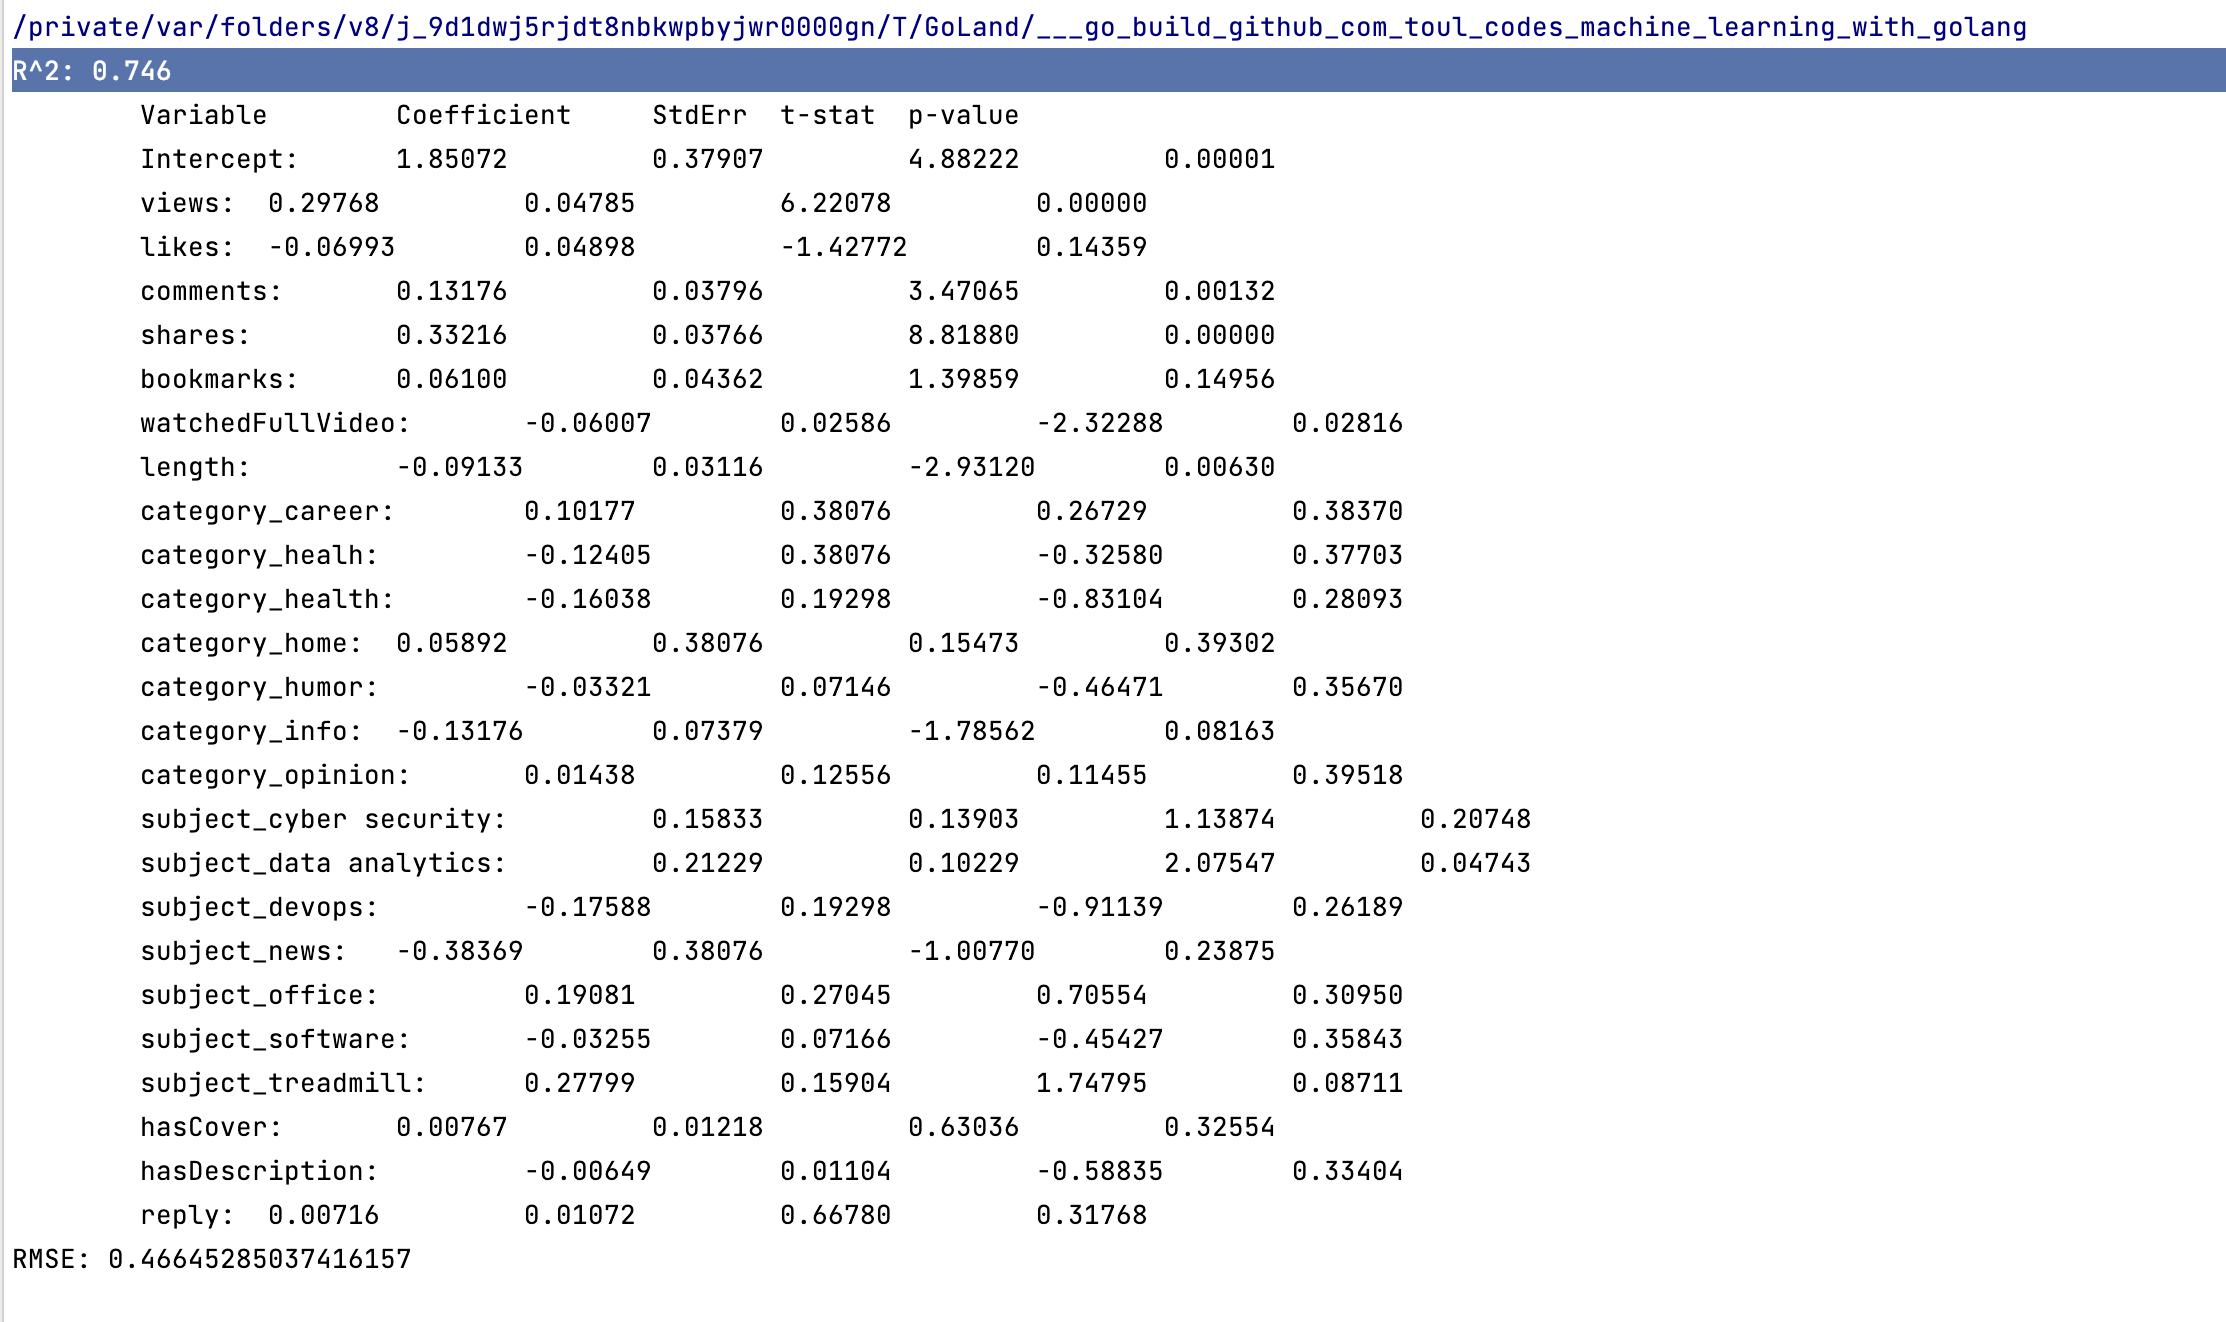
Now, something like the following should be outputted on the terminal:
V.a Interpreting Results
The first thing to do is to convert the output into a more user-friendly format and for me, that's a *.CSV file, which is just adding commas between the column like so:
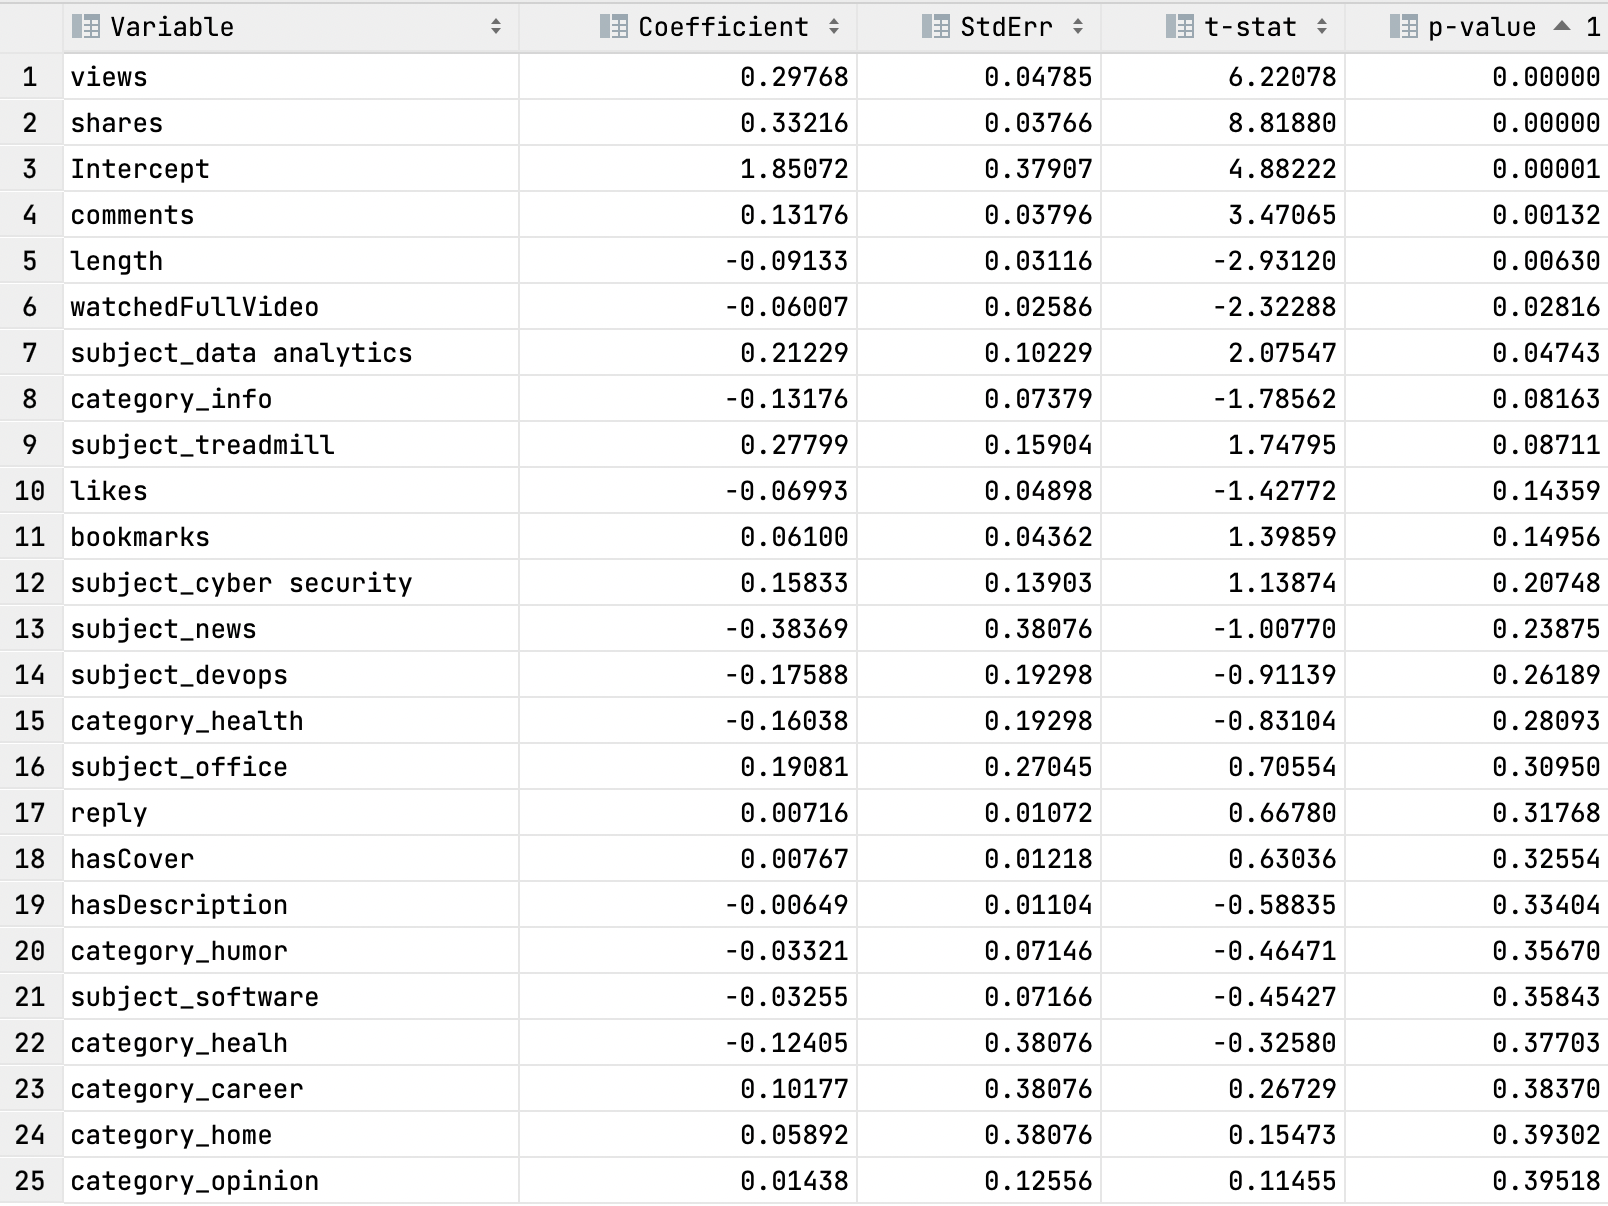
The column of most interest is the P-value column which essentially tells us whether on not that variable supports the idea of obtaining newFollowers.
Here's an easy chart to know what p-value supports the idea and what value doesn't.
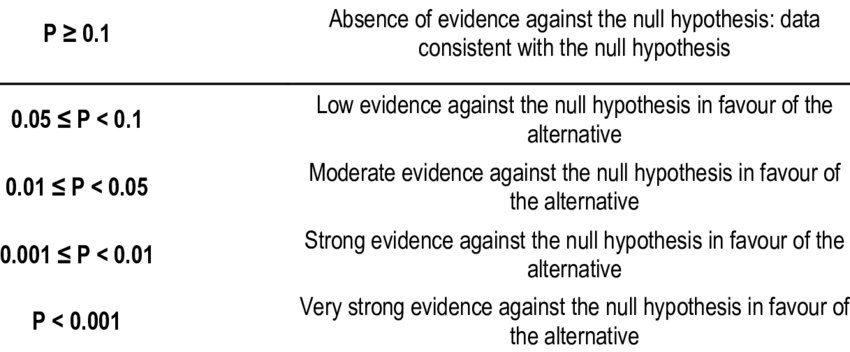
Using the chart and the results of the Linear Regression model, we can see that the following
variables are vital to gaining newFollowers for my channel.
Positive Coefficient (Column 1)
- Views
- Shares
- Comments
- Subject Data Analytics
These variables have positive values in the first column (Coefficient). This finding supports the idea that If I create videos about Data Analytics that get shares, views, and comments then people will probably follow me.
Negative Coefficient (Column 1)
- Length
- Watched full video
One interpretation of the results can be that If I make a video of a certain length and people aren't watching it all the way through then they will not follow me-- not a chance at all.
I can see evidence of this on videos considered long by TikTok standards, which is 10s plus. The worst performing ones are the 50s and reply to viewer questions, for the most part.
V.b Model Strength
Now that there's a general interpretation of the results, we should note how strong the model used to generate them is.
Two values aim to answer that question from the actual output on the terminal.
R^2 = 0.746
RMSE = 0.466
V.b.1 R^2
Tells the proportion of the variance in the response variable of a regression model that is explainable by predictor variables. It ranges from 0 to 1; the higher the value, the better the model fits the dataset.
This tells us that the predictor columns can successfully explain the newFollowers for my channel.
But we'll also want to use RMSE before forming a conclusion.
V.b.2 RMSE - Root Mean Squared Error
The metric that tells how far apart the predicted values are from the actual values in the data set on average.
Typically, the lower the RMSE, the better. For this context, the model can say that the difference between predicting a newFollower is 0.46 of a follower.
Meaning that if a video obtained 5 followers, it would predict 4.54 followers gained for it. Not bad at all.
Conclusion
I didn't think the subject of Data Analytics would be the most promising subject to make videos about on my TikTok. The findings from the model are surprising. I would have expected that the subject Software would have been the best performer since I've made many more videos about it.
However, due to the data set's size, I don't think the findings are conclusive.
So, I'll keep making TikToks, and throw data analytics jokes back into the rotation to see if the hypothesis holds.